Portfolio Analytics Lab
Your investments, your PAL.
Track your Trading212 portfolio, dividends, cashflows, PnL and performance from a web-based dashboard built for clarity, experimentation and transparency.
Manual inputs can also be used to include data from other brokers.
Open the app
Use the app directly from your browser at the dedicated app domain.
Portfolio Analytics Lab Web App
Track your Trading212 portfolio, dividends, cashflows, PnL and performance from a web-based dashboard. Manual inputs can also be used to include data from other brokers.
Open the app, sign in, and start exploring your portfolio analytics workspace.
Features
Built for flexible portfolio analysis, experimentation, and transparent personal finance tracking.
Portfolio overview
Track portfolio value, allocation, exposure, PnL and broker-level breakdowns.
Holdings analysis
Analyze positions by symbol, broker, currency, asset type and custom classifications.
Dividends & cashflows
Review dividends, taxes, fees, deposits, withdrawals and cash movements.
Manual broker imports
Import normalized CSV files from brokers that do not provide direct API access.
Trading212 API support
Started with Trading212 API support, then extended with user-managed manual broker imports.
Decision support
Use filters, exports and analytics views to understand portfolio decisions more clearly.
Detailed capabilities
A deeper look at the current dashboard modules based on the actual app tabs and data flow.
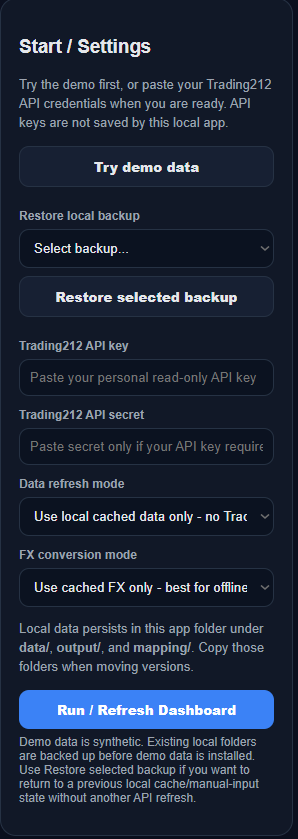
Data sources & refresh modes
- Trading212 API refresh for account, portfolio, metadata, orders, dividends and transactions
- Refresh current year only for faster updates after the first full run
- Full refresh mode for rebuilding all available history
- Cache-only mode for offline/local testing without new Trading212 calls
- Status log that shows each processing step during refresh
Web-based data control
- Portfolio data is processed locally inside the app folder
- API keys are entered at runtime and are not saved by the app
- Local folders for data, output and mapping can be copied between versions
- Backup and restore flow for local data states
- Synthetic demo data to explore the app before using real API credentials
Portfolio overview
- Portfolio value, price PnL, FX impact and total PnL summary cards
- Dividend total and trailing dividend yield metrics
- Largest position and top-five concentration views
- Broker-level and symbol-level portfolio visibility
- Top current positions by calculated market value
Holdings analysis
- Filters for symbol, asset type, sector and broker
- Top-N holdings charts with custom top-N option
- Exact symbol matching for cleaner ticker filtering
- Sortable and scrollable holdings tables
- Mapping support for display names, true tickers and classifications
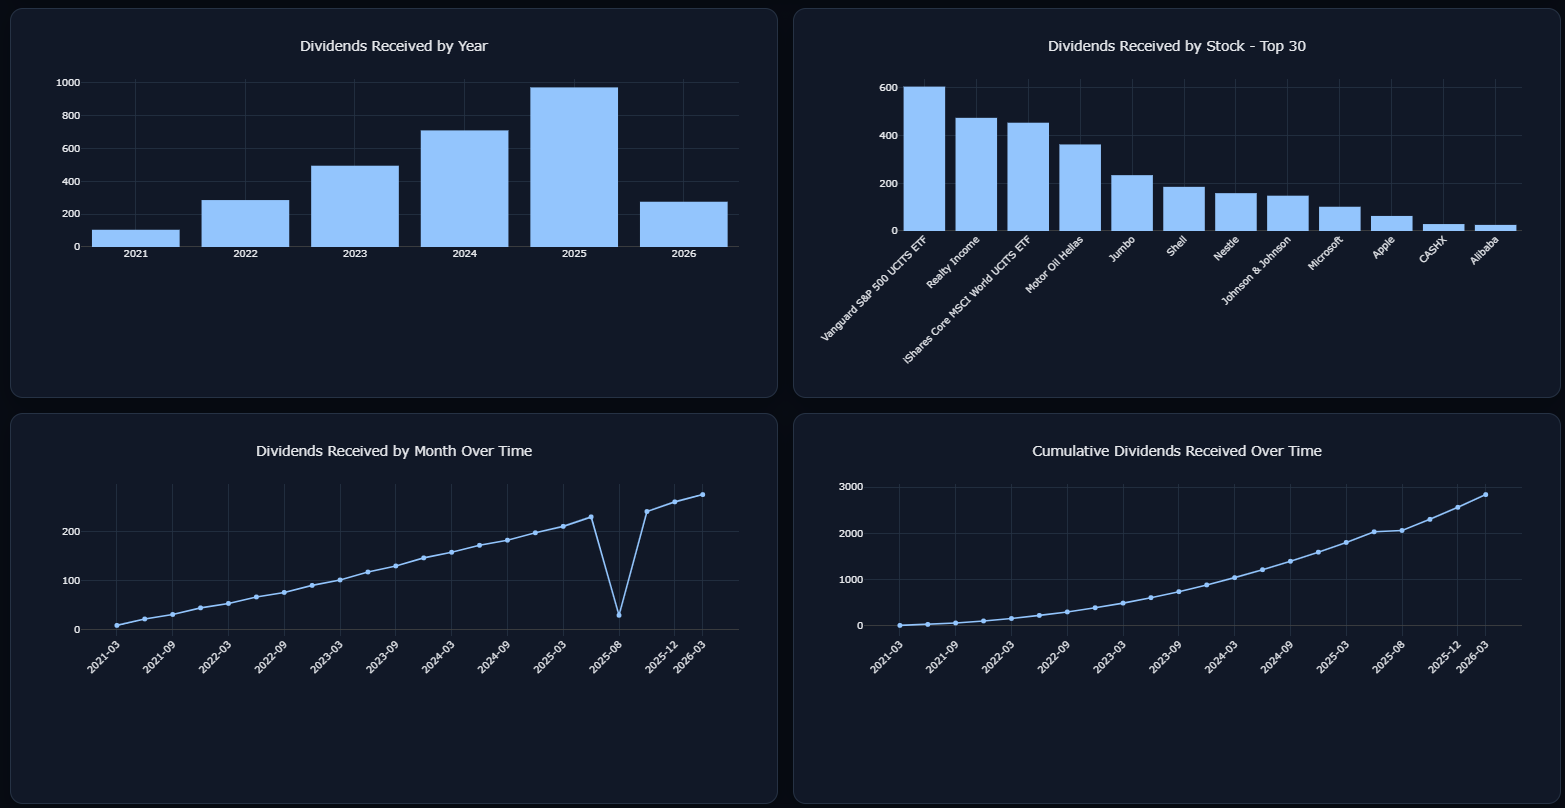
Dividends & income analysis
- Dividends received by year and by stock
- Monthly dividend timeline and cumulative dividend chart
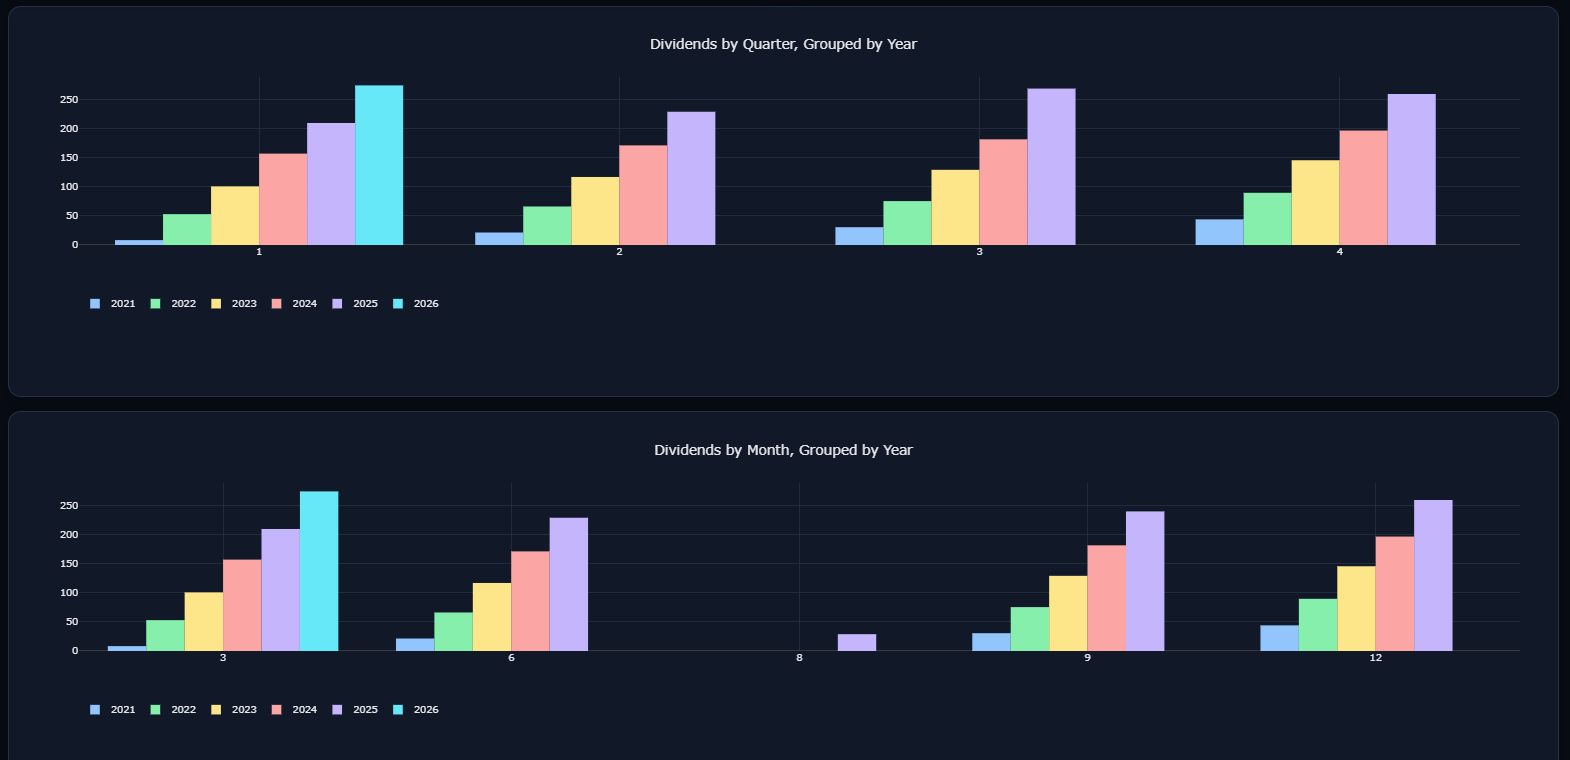
- Dividend seasonality by quarter and month, grouped by year
- Dividend filters by symbol, year and broker
- Manual dividend rows supported through the Data Manager
PnL, activity & decision quality
- Price PnL, FX impact and total unrealized PnL views
- Activity/order analysis from broker history and manual inputs
- Net buy value by year and month
- Experimental decision-quality view by symbol
- Observed result combining available realized PnL, open PnL and dividends
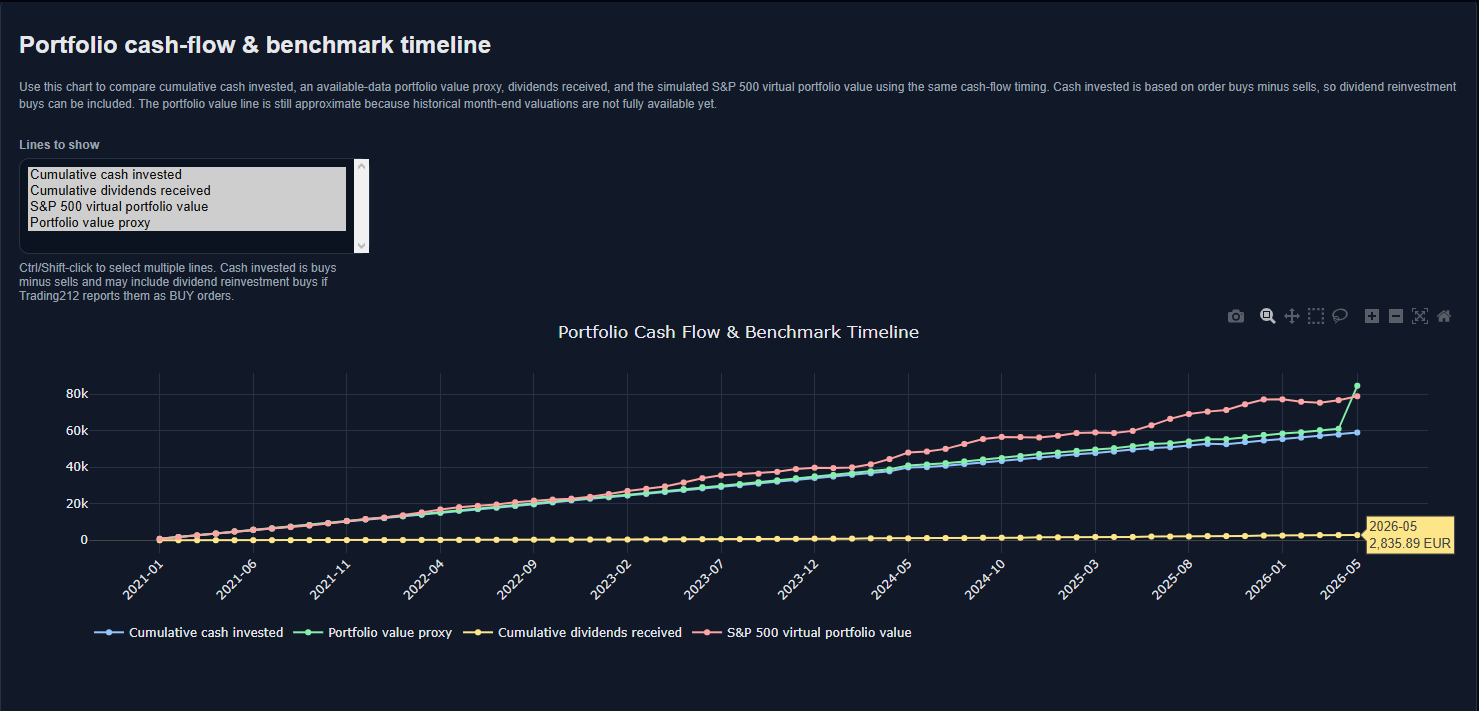
Forecasting & benchmarking
- Scenario-based forecasting, not prediction
- Historical annualized and average-based projection methods
- Manual assumptions for return, dividend growth and annual contribution
- Automatic S&P 500 benchmark cache from free public data sources
- Cash-flow timing comparison against a virtual S&P 500 portfolio
Manual broker inputs
- Manual transactions table for buys, sells, dividends, deposits, withdrawals, fees, taxes and FX adjustments
- Manual positions table for holdings from other brokers
- Upload flow for normalized manual source files
- Validation warnings for missing dates, symbols, amounts or FX rates
- Manual rows are stored locally and integrated during dashboard rebuild
Tax Prep Hub
- Tax-year summary cards for dividends, withholding tax, realized activity and review-required items
- Tax readiness checks for missing dates, symbols, currencies, FX rates and incomplete sell/realized-PnL data
- Accountant-ready summary, questions for accountant and copyable LLM prompt generator
- Global-first treatment labels such as potentially taxable, potentially exempt, review required and informational only
- Single Excel Tax Prep Workbook export for review and preparation
Mapping & enrichment
- Editable ticker mapping table
- True ticker and display-name cleanup
- Asset type, sector, industry and country enrichment
- ETF, leveraged, risk bucket and custom portfolio flags
- Save mapping and refresh dashboard from local cache
Self-service analytics
- Create quick charts from dashboard tables
- Choose dataset, X axis, Y axis and optional split/group field
- Bar, line and scatter chart support
- Filter values and max-row controls before plotting
- Recommended setup and random plot options for exploration
Exports & reporting
- Download latest Excel workbook
- Individual CSV downloads for output tables
- Custom HTML report builder from selected dashboard sections
- Export workflow for offline review and sharing
- Transparent source tables can be enabled for testing and auditability
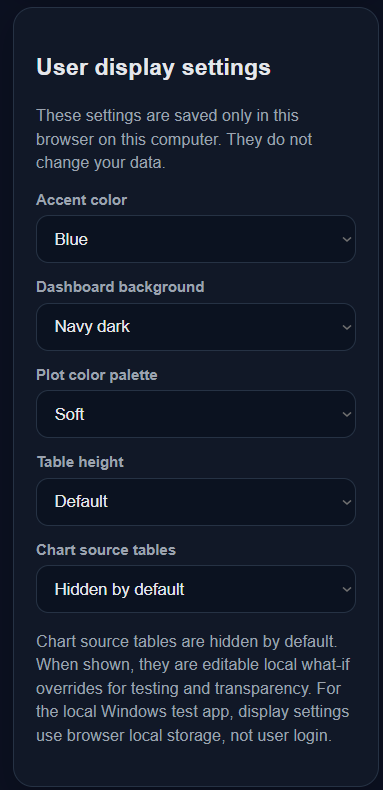
Display & usability
- Browser-local display settings
- Accent color and dashboard background options
- Plot palette and table-height settings
- Chart source tables hidden by default but available when needed
- Responsive chart resizing and tab-based dashboard navigation
Screenshots
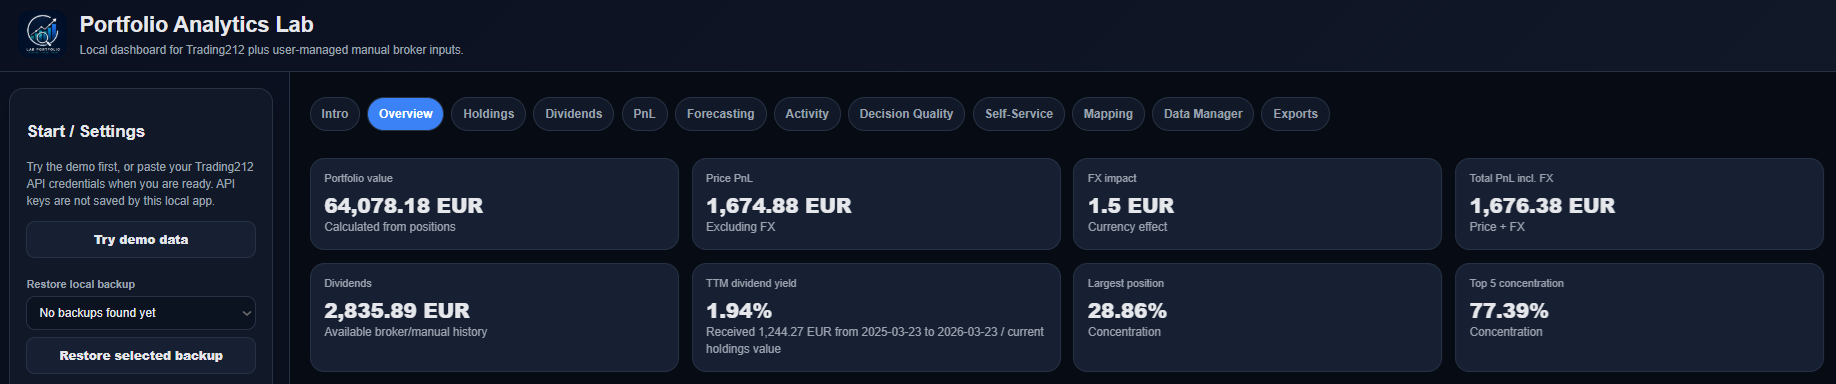
Overview dashboard
Main portfolio view with portfolio value, price PnL, FX impact, dividends, yield, concentration and key navigation tabs.
Product updates
Recent improvements and feature highlights.
v0.1.2 Alpha - May 2026
Added
- Tax Prep Hub for organizing tax-relevant portfolio activity
- Tax summary cards for dividends, withholding tax, realized activity and review-required items
- Tax readiness/data-quality checks and accountant questions
- Copyable prompt generator for accountant/LLM review
- Single Excel Tax Prep Workbook export
v0.1.1 Alpha - May 2026
Added
- Self-Service chart setup improvements
v0.1.0 Alpha - May 2026
Added
- Initial browser-based portfolio analytics dashboard
- Trading212 beta API support
- Manual transactions and positions input
- Portfolio overview, dividends, cashflows, PnL and benchmark analytics
Data privacy
Portfolio Analytics Lab is a web-based portfolio analytics dashboard built with privacy and transparency in mind. You control the inputs you provide, and you are responsible for keeping your account, API keys, broker exports and local files secure. Portfolio Analytics Lab is not financial or tax advice.
Community
Join the community for feedback, bug reports, setup questions and feature ideas.
When reporting an issue, mention the tab, what you clicked, and attach a screenshot if useful. Do not share API keys or private full exports publicly.
Buy me a coffee
If you found value using the tool, a coffee helps keep it going. Support is optional and helps cover hosting, maintenance costs, testing, packaging and future development.

BTC Lightning / Wallet of Satoshi